

The Penobscot Bay Experiment: Moored Current Measurements During 1999 and Hydrographic/Current Survey from 27 -
29 August 1999
Data Report Reference 00-1
L. Mangum, J. Wallinga, R. Stessel, N. Pettigrew
University of Maine

INTRODUCTION
This report presents data collected from December 1998 through November 1999 as part of an ongoing investigation of the physical oceanography of Penobscot Bay. The goal of this research is to delineate the principle features of the residual circulation pattern and its temporal variability in Penobscot Bay.
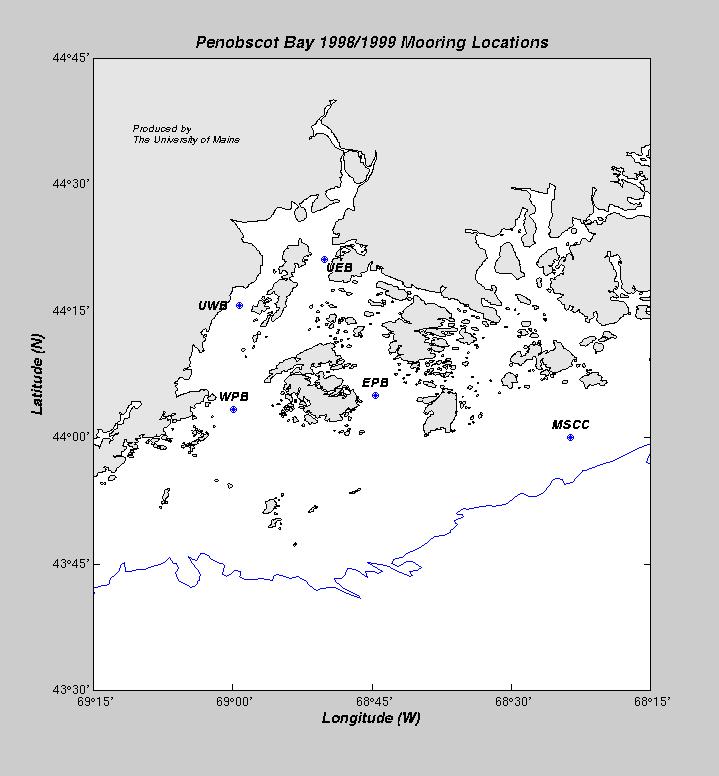
Four moored buoys (Figure 1
) in Penobscot Bay and one offshore mooring near Mount Desert
Rock (Figure 2)
measured surface meteorological information and
ocean currents from the surface to near bottom in addition to
collecting temperature and conductivity information at discrete points in the
upper water column. The moorings were deployed during November and December
1998 on the RV ARGO MAINE and were recovered during November 1999 on the
FV MOBY DICK. The RV ARGO MAINE was also used in May 1999 to
recover and redeploy the offshore mooring that had developed equipment
problems.
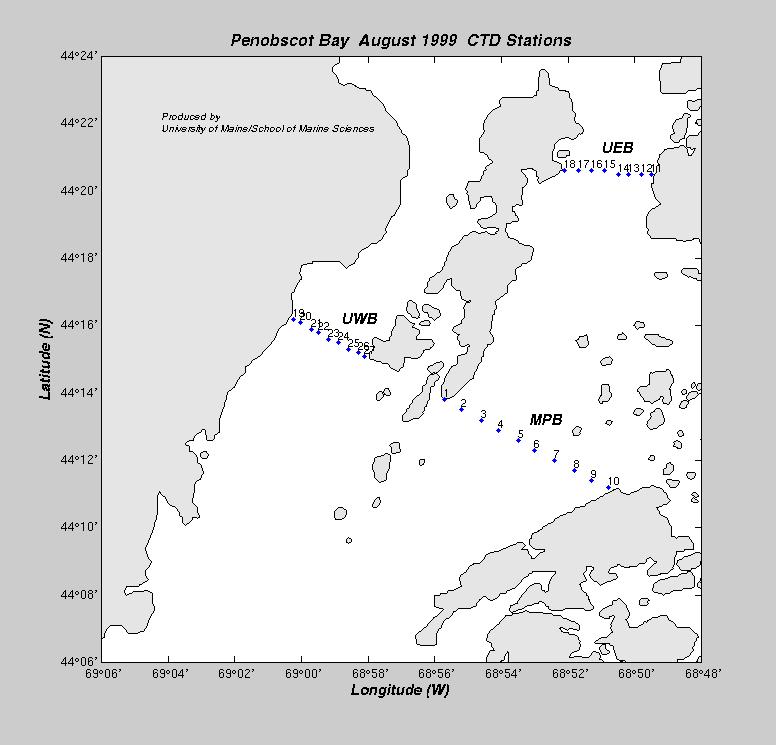
The hydrographic survey was conducted on August 27, 28, and 29 1999 on the
RV ALICE SIEGMUND . The survey consisted of CTD stations and an ADCP
velocity profiler mounted on the side of the vessel, that measured the
velocity throughout the water column.
The three day measurement program was
designed to characterize the circulation in upper Penobscot bay along
cross-channel transects during the post freshet/summer conditions (
Figure 3).
TECHNICAL OVERVIEW
MOORED BUOY ACQUISTION
-
General Buoy Description
Four Ocean Data Acquisition System (ODAS) moorings (Figure 1) in Penobscot Bay and one mooring off the coast of Maine were deployed during November and December 1998 ( Figure 2). The moorings were configured with a surface float and tower. Each buoy was equipped with a solar-powered GPS and data telemetry unit, radar reflector, and lantern.
At a depth of 2 meters on the four moorings in Penobscot Bay, a 3D-ACM Coastal current meter from Falmouth Scientific, Inc. measured near-surface current speeds and directions with a 2-minute burst sample every 30 minutes. Three meters below the surface float on all five moorings was mounted a RD Instruments Acoustic Doppler Current Profiler (ADCP) in the downward looking configuration. The ADCP on each mooring was programmed to sample the water velocity at discrete time and depth intervals and then average those samples in time and depth. Two moorings in upper Penobscot Bay were also equipped with an RM Young wind and air temperature sensor. All current and surface meteorological data were sent to the Campbell Scientific data logger that transmitted the data daily via a cell phone link to the University. SBE 16-03 Seacats from Sea-Bird, Inc., recorded temperature and conductivity (T/C) samples at a rate of one sample every 15 minutes. These were attached to the mooring at selected depths and data were recorded in the instrument and were downloaded after the mooring was recovered. -
West Penobscot Bay
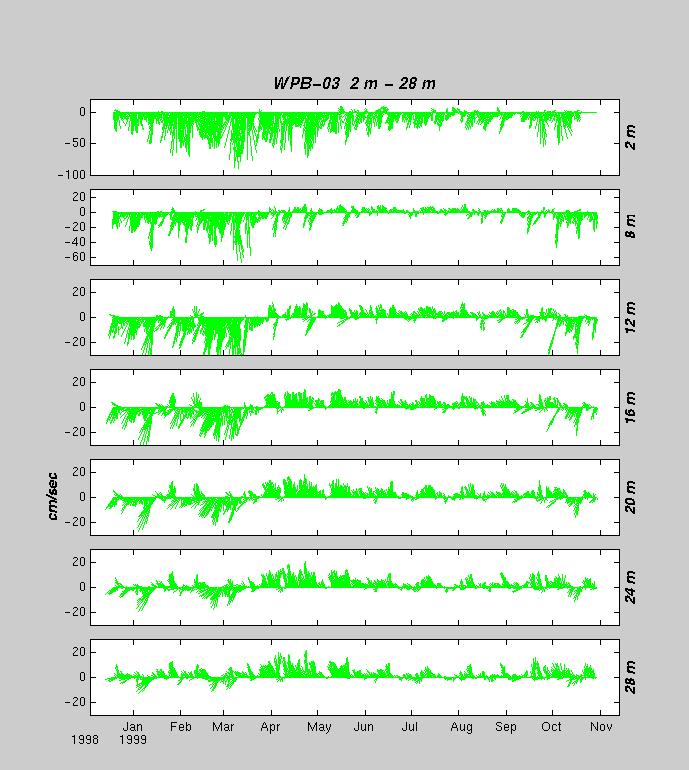
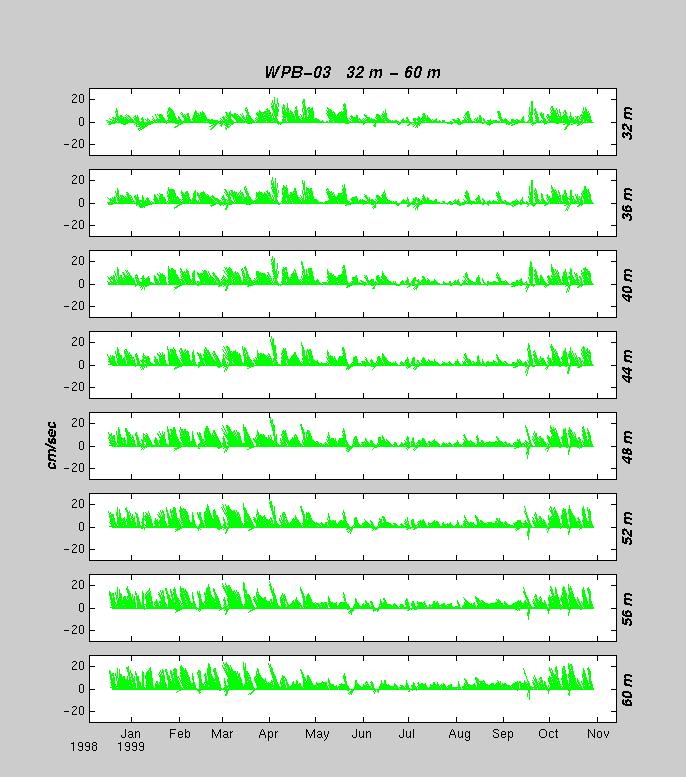
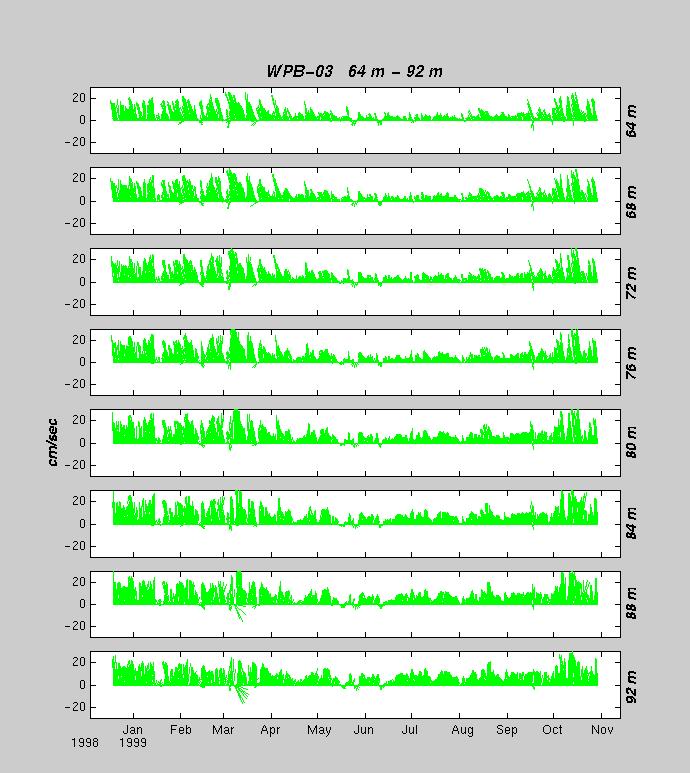
The West Penobscot Bay mooring (WPB-03) was deployed on 17 December 1998 at 44° 03.3´N, 068° 59.8´W (Figure 2), outside of Rockland Harbor, about 1 1/4 nautical miles east/southeast of Monroe Island. The water depth was approximately 104 meters. The 2-meter FSI current meter data were hourly averaged and then low-pass filtered. The downward-looking ADCP was a 300 kHz Workhorse Sentinel configured for thirty 4-meter depth bins. The transducer of the instrument was at a depth of 3.3 meters below the surface. After removal of data affected by acoustic side-lobe contamination, the good data bins were centered at depths ranging from 8 to 88 meters at 4-meter intervals. The low-passed filtered time series of the currents measured by WPB-03 are shown in Figures 4, 5, and 6.
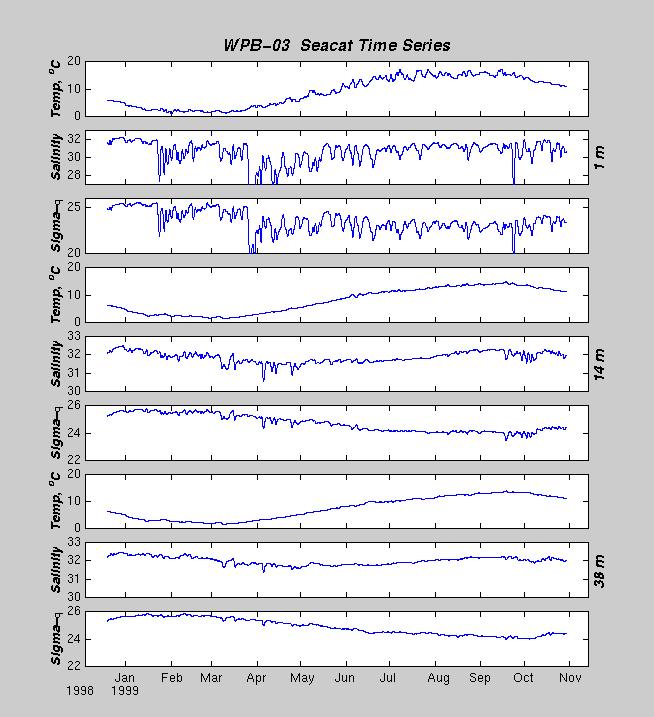
Three Seacat T/C recorders were mounted on the mooring. The uppermost Seacat was secured to a well attached to the buoy approximately 1 meter below the water's surface. The second and third Seacats were mounted in trawl resistant frames and Crosby-clamped to the mooring cable at 14 and 38 meters respectively. The Seacats were recalibrated at Sea-Bird Inc. after they were recovered and the post-deployment calibrations were applied to the temperature and conductivity data. The low-passed filtered Seacat time series are shown in Figure 7.
The 2-meter FSI current meter failed in mid-October 1999 due to problems in the data logger. On 31 October 1999, the mooring broke free from its anchor. It continued to send GPS positions and on 1 November 1999, the RV ALICE SIEGMUND located the surface float and towed it back to Rockland Harbor. The failure in the mooring was just below the bottom Seacat and all instruments were recovered without damage.
-
East Penobscot Bay
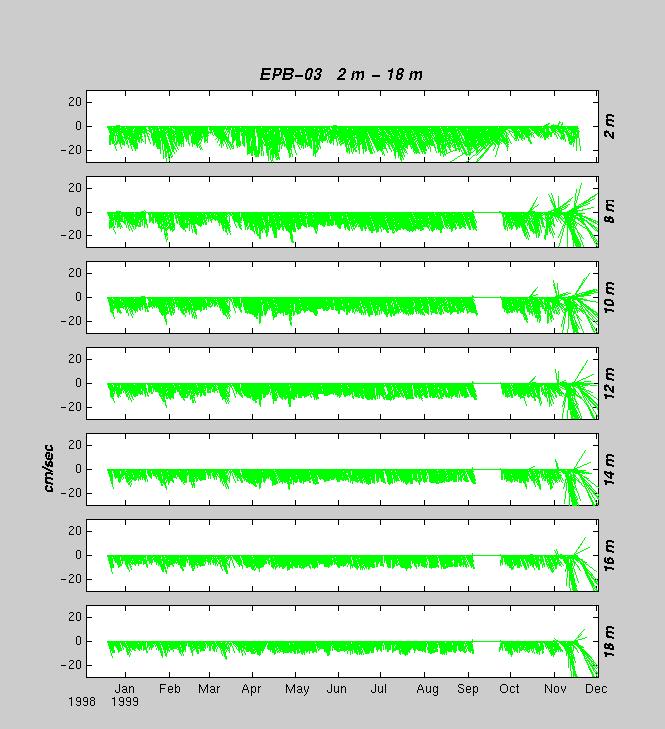
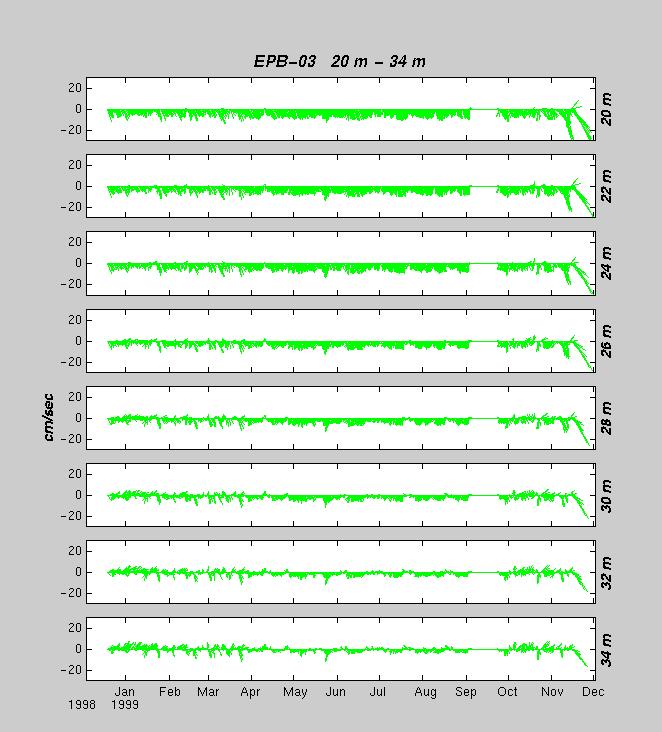
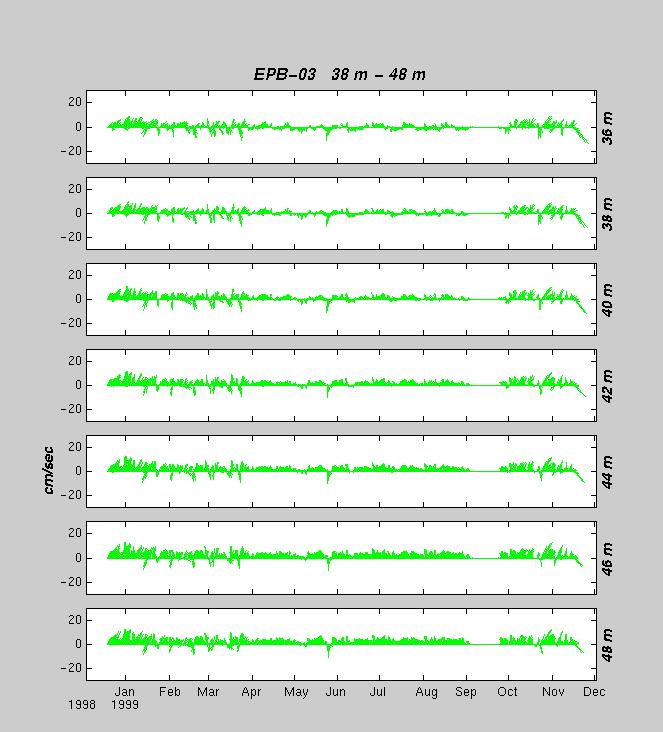
The East Penobscot Bay mooring (EPB-03) was deployed on 17 December 1998 and was located at 44° 05.0´N and 069° 44.0´W ( Figure 2), approximately 2 nautical miles east of Brown's Ledge just off of Vinalhaven Island. The water depth was approximately 56 meters. The 2-meter FSI current meter data were hourly averaged and then low-pass filtered. The downward-looking ADCP was a 300 kHz Workhorse Sentinel configured for thirty 2-meter depth bins. The transducer of the instrument was at a depth of 3.3 meters below the surface. After removal of data affected by acoustic side-lobe contamination, the good data bins were centered at depths ranging from 8 to 48 meters at 2-meter intervals. The low-passed filtered time series of the currents measured at EPB-03 are shown in Figures 8, 9, and 10. The doppler battery failed in early September 1999 and there was no doppler data recorded from 3 September until 21 September, when a new battery was installed on EPB-03 to power the doppler profiler.
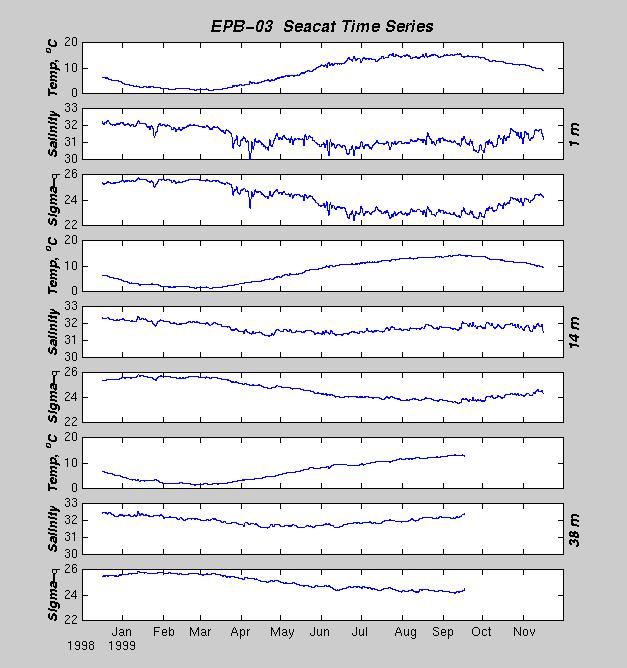
Three Seacat T/C recorders were mounted on the mooring. The uppermost Seacat was secured to a well attached to the buoy approximately 1 meter below the water's surface. The second and third Seacats were mounted in trawl resistant frames and Crosby-clamped to the mooring cable at 14 and 38 meters respectively. The Seacats were recalibrated at Sea-Bird Inc. after they were recovered and the post-deployment calibrations were applied to the temperature and conductivity data. The low-passed filtered Seacat time series are shown in Figure 11. A battery failure in the 38-meter Seacat ended the time series in September 1999.
-
Upper West Penobscot Bay
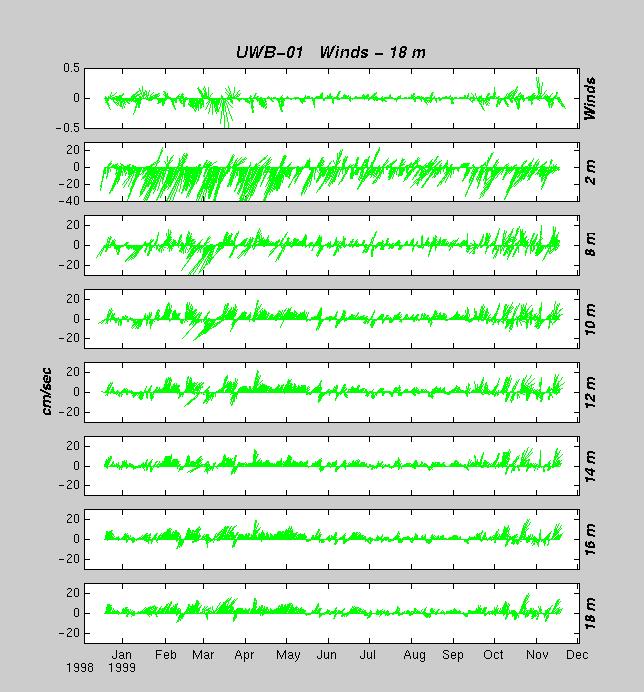
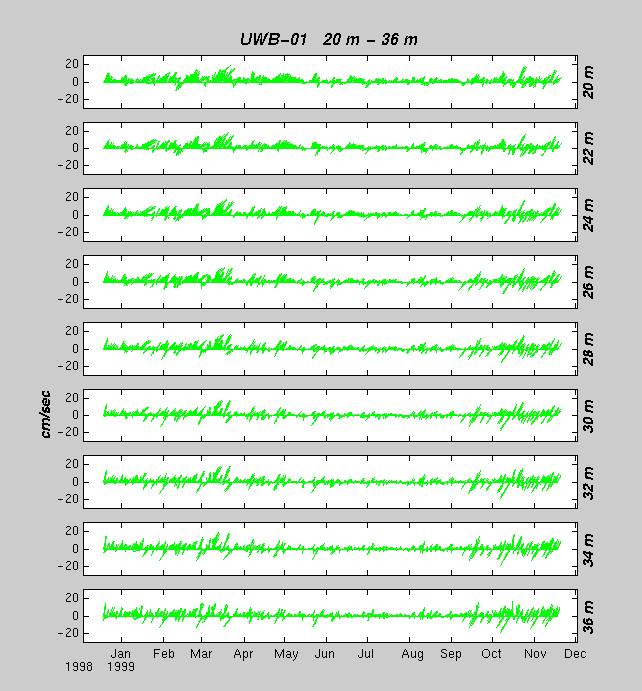
The Upper West Penobscot Bay mooring (UWB-01) was deployed on 17 December 1998 and was located at 44° 15.7´N and 068° 59.2´W ( Figure 2), less than 1 nautical mile southeast of Linconville. The water depth was approximately 41 meters. The 2-meter FSI current meter data were hourly averaged and then low-pass filtered The downward-looking ADCP was a 300 kHz Workhorse Sentinel configured for twenty-five 2-meter depth bins. The transducer of the instrument was at a depth of 3.3 meters below the surface. After removal of data affected by acoustic side-lobe contamination, the good data bins were centered at depths ranging from 8 to 36 meters at 2-meter intervals. The low-passed filtered time series of the currents measured at UWB-01 are shown in Figures 12 and 13.
This mooring was also equipped with a RM Young wind and air temperature sensor. The wind speed and direction were converted to wind stress (measured in pascals) and is plotted with the near-surface currents on Figure 12.
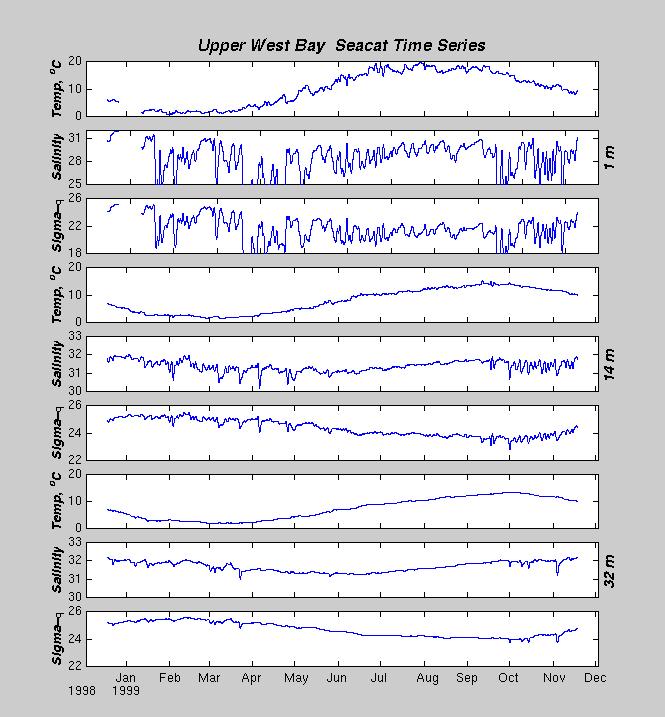
Three Seacat T/C recorders were mounted on the mooring. The uppermost Seacat was secured to a well attached to the buoy approximately 1 meter below the water's surface. The second and third Seacats were mounted in trawl resistant frames and Crosby-clamped to the mooring cable at 14 and 32 meters respectively. The Seacats at 1 meter and 14 meters were recalibrated at Sea-Bird Inc. after they were recovered and the post-deployment calibrations were applied to the temperature and conductivity data. Pre-deployment calibrations were applied to the 32-meter Seacat. The low-passed filtered Seacat time series are shown in Figure 14.The surface Seacat had some temperature circuit problems in late December 1998 but the data from the remainder of the deployment period appear fine.
-
Upper East Penobscot Bay
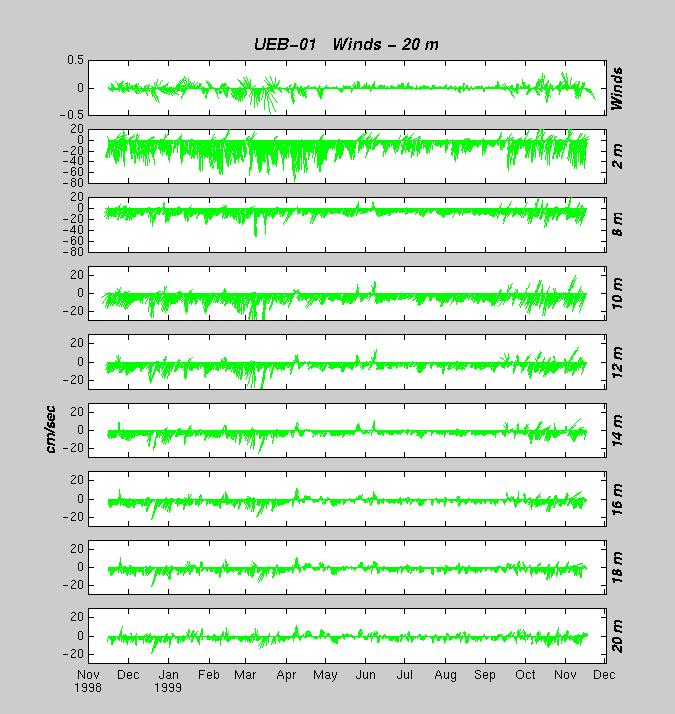
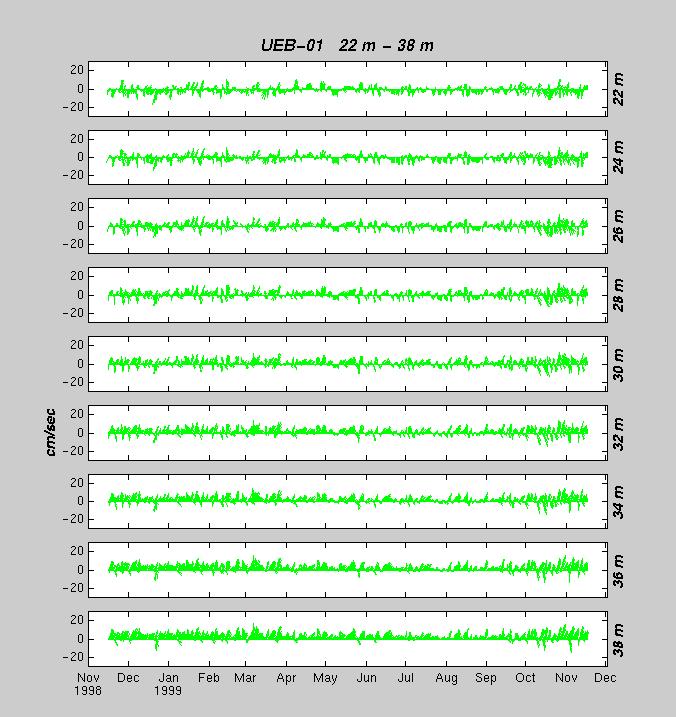
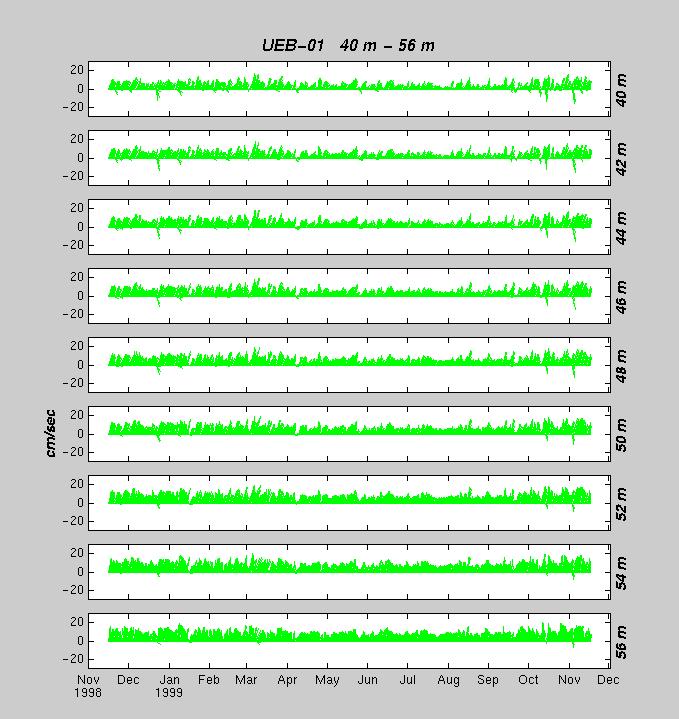
The Upper East Penobscot Bay mooring (UEB-01) was deployed on 14 November 1998 and was located at 44° 21.1´N and 068° 50.5´W ( Figure 2), between the Isleboro Ledge and Harborside. The water depth was approximately 63 meters. The 2-meter FSI current meter data were hourly averaged and then low-pass filtered. The downward-looking ADCP was a 300 kHz Workhorse Sentinel configured for thirty-two 2-meter depth bins. The transducer of the instrument was at a depth of 3.3 meters below the surface. After removal of data affected by acoustic side-lobe contamination, the good data bins were centered at depths ranging from 8 to 52 meters at 2-meter intervals. The low-passed filtered time series of the currents measured at UEB-01 are shown in Figures 15, 16, and 17.
This mooring was also equipped with an RM Young wind and air temperature sensor. The wind sensor was replaced in September due to faulty bearings in the rotor assembly that effectively reduced the speed of the measured wind. It is believed that the measured wind speeds during the summer of 1999 may be underestimated. The wind speed and direction were converted to wind stress (measured in pascals) and is plotted with the near-surface currents on Figure 15.
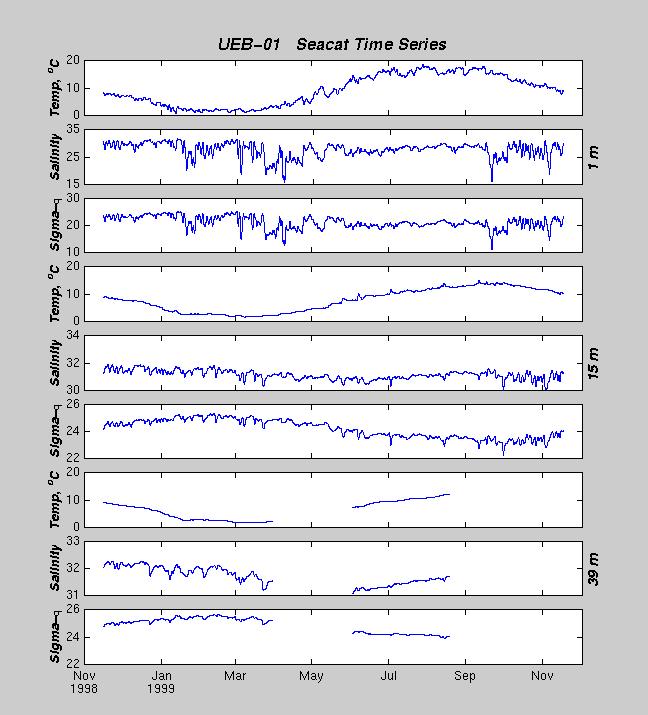
Three Seacat T/C recorders were mounted on the mooring. The uppermost Seacat was secured to a well attached to the buoy approximately 1 meter below the water's surface. The second and third Seacats were mounted in trawl resistant frames and Crosby-clamped to the mooring cable at 15 and 39 meters respectively. The Seacats at 1 meter and 39 meters were recalibrated at Sea-Bird Inc. after they were recovered and the post-deployment calibrations were applied to the temperature and conductivity data. Pre-deployment calibrations were applied to the 15-meter Seacat. The low-passed filtered Seacat time series are shown in Figure 18. The Seacat at 39 meters had intermittent problems with the temperature circuits before the batteries failed in late August 1999.
-
Maine Shallow Coastal Current
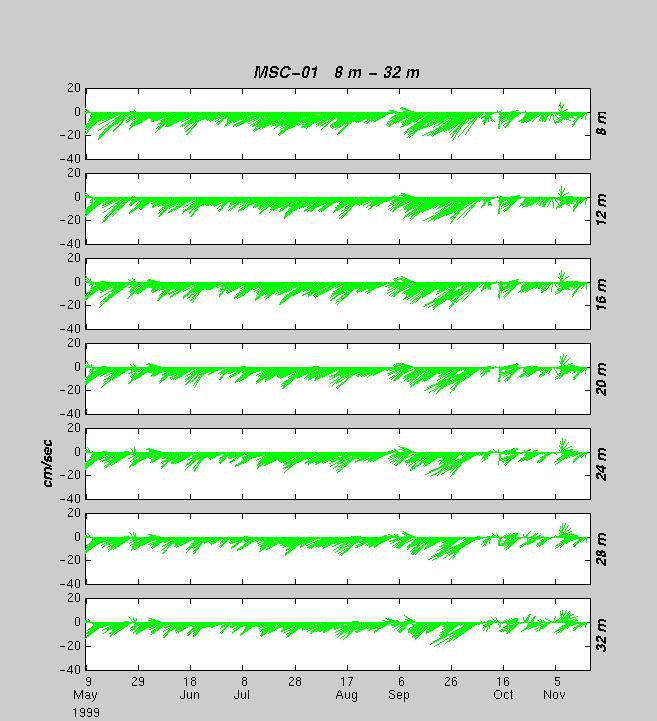
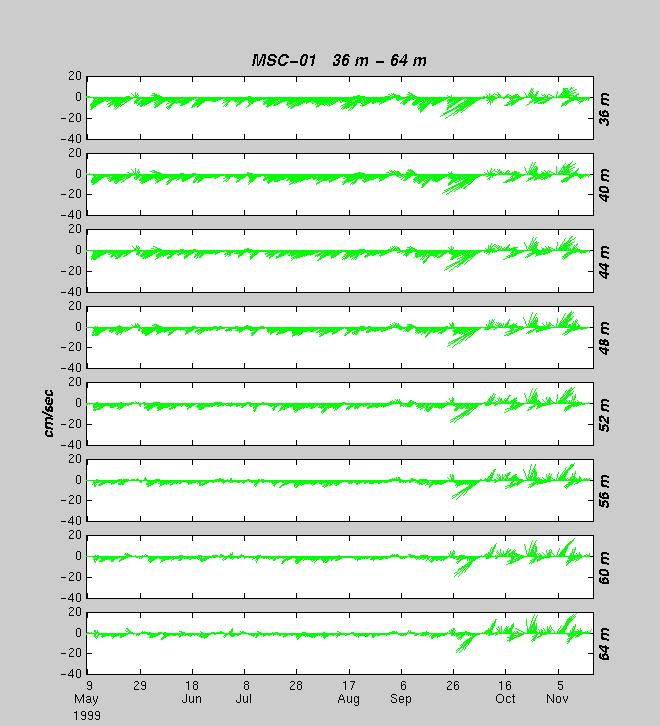
The Maine Shallow Coastal Current (MSC-01) was deployed on 14 November 1998 and was located at 44° 00.6´N and 068° 23.5´W, about 5.5 nautical miles south of Long Island. The water depth was approximately 83 meters. The mooring was deployed with a downward-looking ADCP that was a 300 kHz Workhorse Sentinel configured for twenty-two 4-meter depth bins. The transducer of the instrument was at a depth of 3.3 meters. However, the doppler profiler failed shortly after the mooring was deployed and no current data were collected until the mooring was replaced on 8 May 1999. The new mooring was equipped with a 150 kHz narrow-band downward-looking doppler profiler. The depth of the transducer was 4 meters below the water's surface. The low-passed filtered current time series from May through November 1999 are shown in Figures 19 and 20.
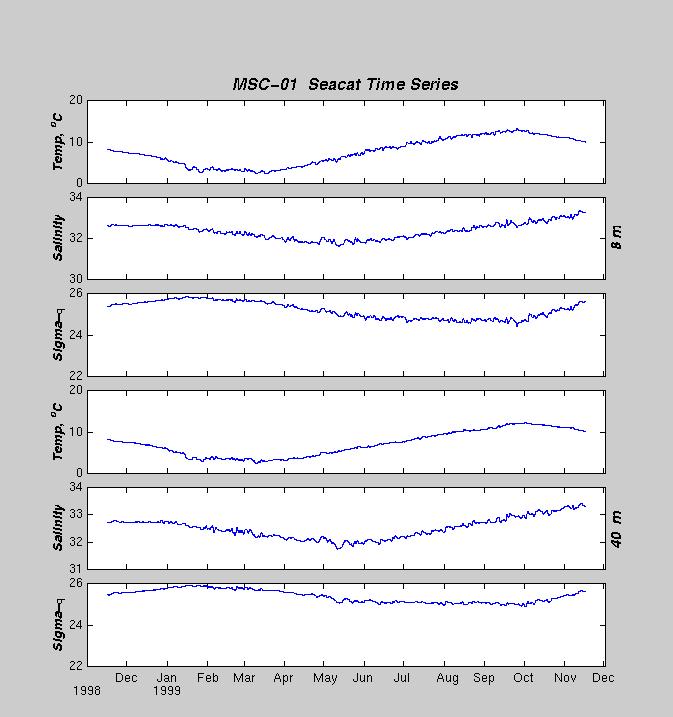
Two Seacat T/C recorders were mounted on the moorings at 8 meters and 40 meters during both mooring deployment periods. Pre-deployment calibrations were applied to the data from both Seacats. The low-passed filtered Seacat time series are shown in Figure 21.
-
Moored Data Processing
MSC-01 was recovered on 18 November 1999, the drifting WPB-03 was recovered on 1 November 1999, and the three remaining buoys in Penobscot Bay were recovered on 19 November 1999. The data from all of the moored instruments were downloaded and archived. The ADCP data and FSI data were converted to ASCII data by using the instrument manufacturers' programs. Once all of the data were converted, a series of Matlab programs was used to further process the data. All data were averaged to hourly values and the current data were rotated to true north coordinates. All data were then low-passed filtered to effectively remove the tidal current velocities, leaving the sub-tidal or residual currents. The MSC-01 current data were rotated to along and cross-shore coordinates. The filtered time series data are shown in Figures 4, 5, 6 (WPB-03); 8, 9, 10 (EPB-03); 12, 13 (UWB-01); 15, 16, 17 (UEB-01); 19, 20. (MSC-01).
The Seacat data were downloaded from the instruments via the program TERM1621, provided by Sea-Bird Electronics, Inc., and then the program DATCNV was used to convert the hexadecimal counts to engineering units in an ASCII format and also applied the calibration coefficients. Salinity, temperature, and potential density (sigma-theta) were calculated and time series data from these instruments are displayed in Figures 7 (WPB-03), 11 (EPB-03), 14 (UWB-01), 18 (UEB-01), and 21 (MSC-01).
-
NOAA Meteorological Data
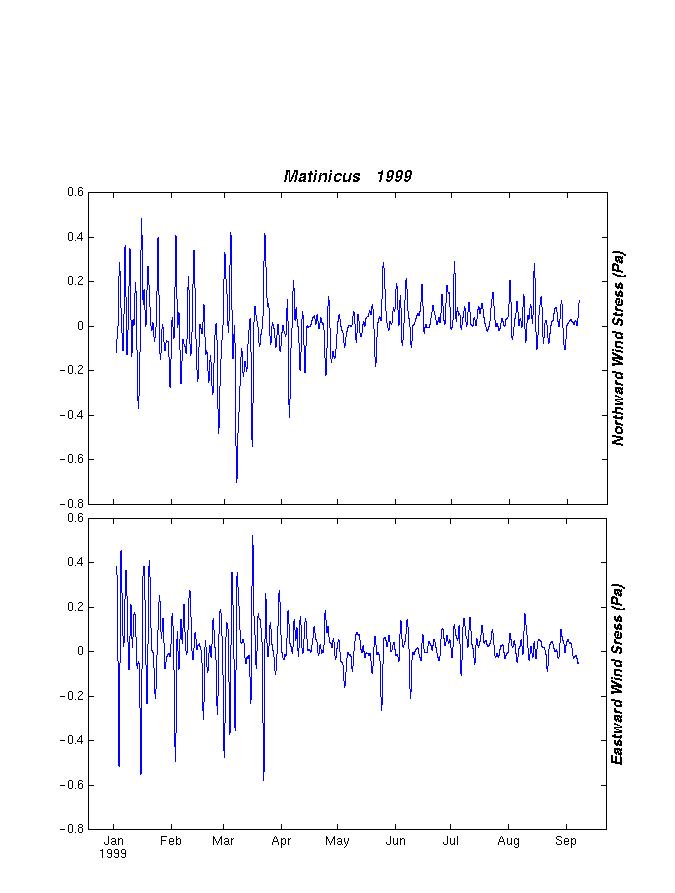
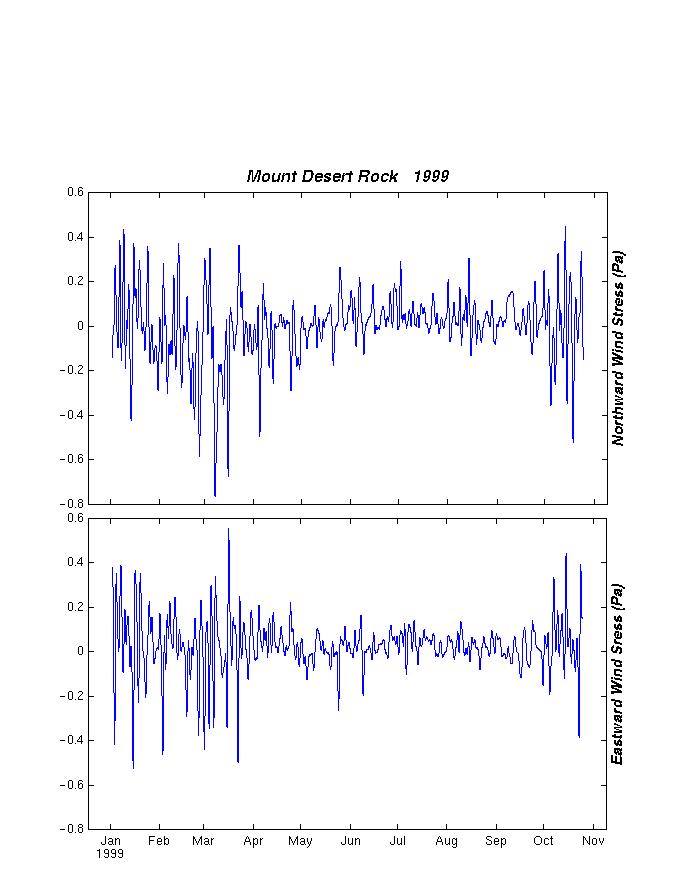
NOAA's National Data Buoy Center maintains moored meteorological buoys and C-MAN stations along the coastal waters of the United States, including several sites in the Gulf of Maine. Wind speed and direction measured by the C-MAN staion on Mount Desert Rock (43° 58.2´N, 068° 07.8´W) were downloaded from their web site. Wind stress was calculated from the wind speed and direction data by assuming a linear drag coefficient of 0.0015 (Gill, 1982). Time series of the low-passed filtered data are shown in Figure 22.
-
Penobscot River Discharge Data
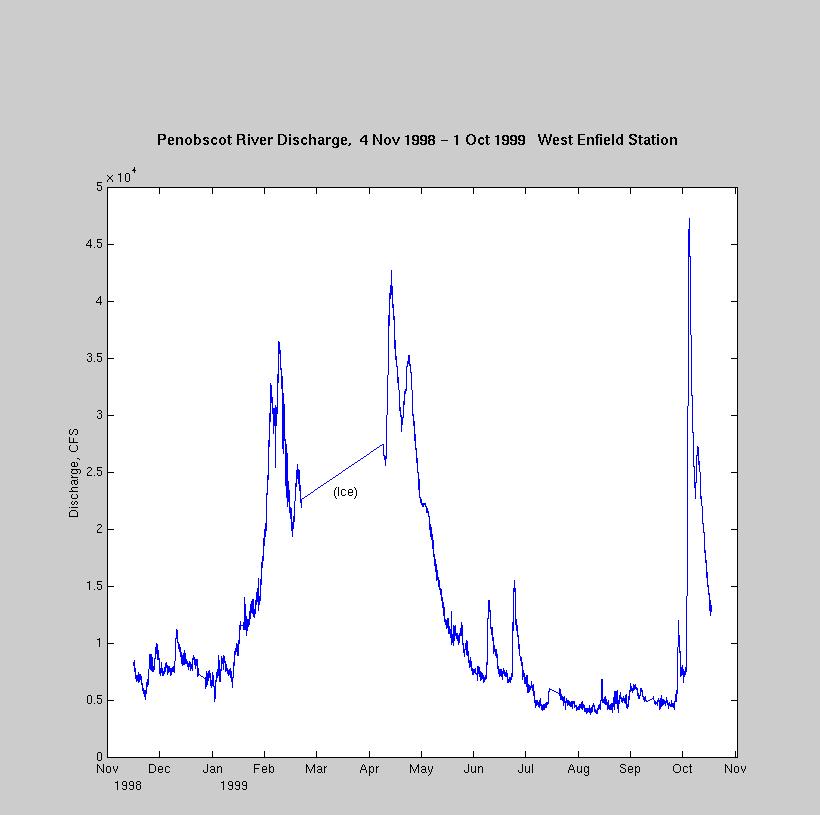
The USGS provides daily averaged river flow data for rivers throughout Maine. Figure 23 is a plot of the Penobscot River discharge measured at West Enfield for the period of the mooring deployment. These data are provisional and subject to verification by the USGS.
HYDROGRAPHIC SURVEY FROM 27-29 AUGUST 1999
-
SHIP MOUNTED ADCP DATA ACQUISITION Mounted on the research vessel, one meter below the water line, was a downward looking 600 kHz Broadband ADCP, manufactured by RD Instruments, Inc., with bottom track capabilities interfaced with a DGPS positioning system and an external fluxgate compass. The ADCP was configured to sample the water column continuously by averaging 4 consecutive "pings" and recording this value as "raw" data, then re-averaging the raw data to 2 minute intervals while the ship was underway. The vertically averaged depth cell size (bin size) was set to 2 meters. The convention used is that the nominal depth of a bin is centered within the 2-meter bin size.
After removal of data affected by acoustic side-lobe contamination and instrument noise, the good data bins were centered at depths ranging from 5 meters below the surface to about 8 meters off the bottom. Since the ADCP, in this configuration, measures water current relative to the ship, the bottom track feature and external compass provide an accurate means for removing the ship's speed and direction from the profile data, resulting in a data set of absolute currents. The DGPS gave continuous and accurate (nominal 5-meter) position fixes which coincide with the current measurements, so the location of a profile was known with great certainty for subsequent tidal current removal.
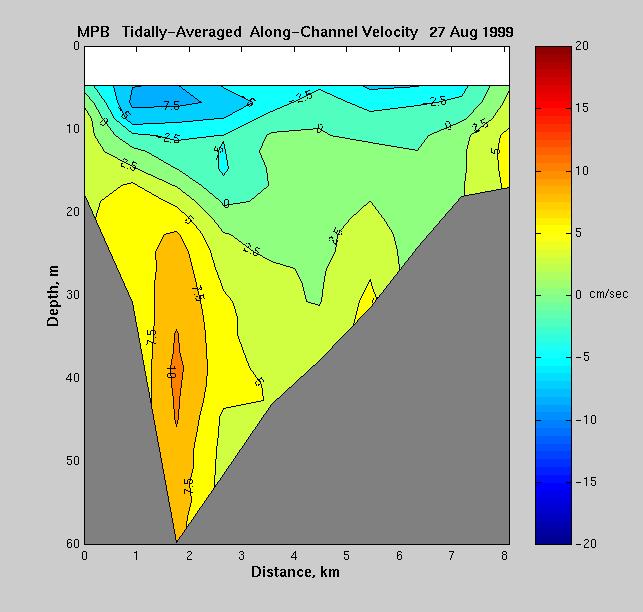
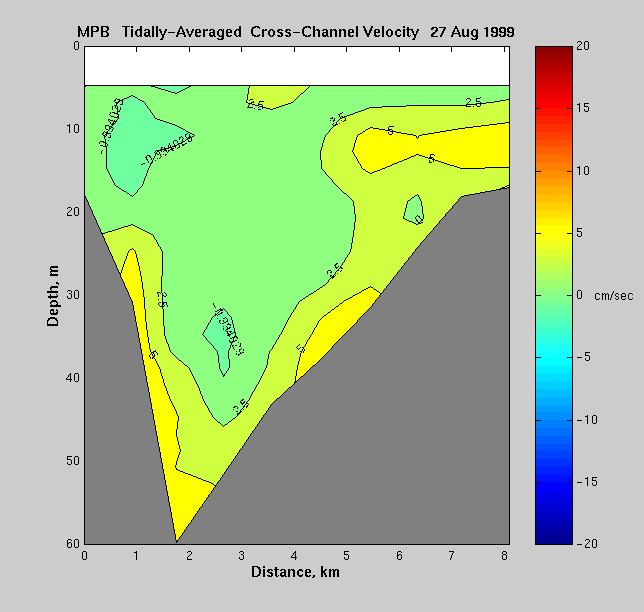
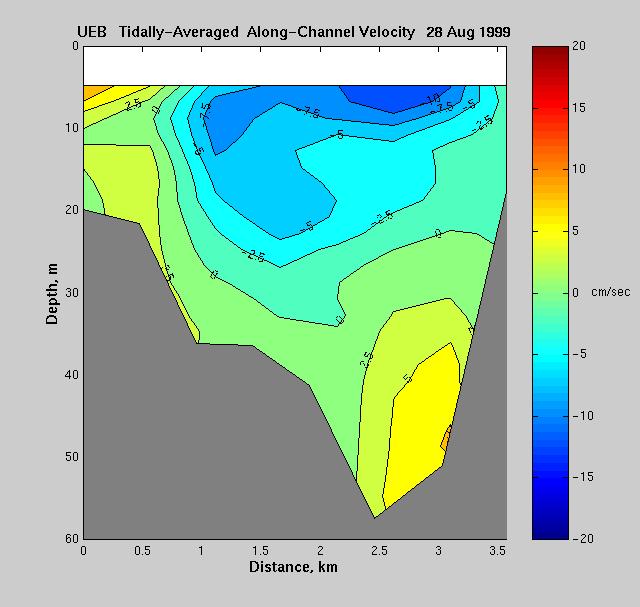
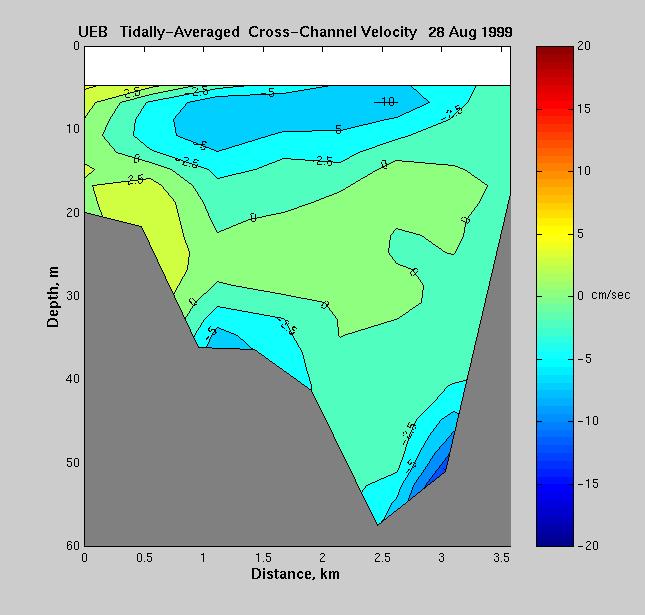
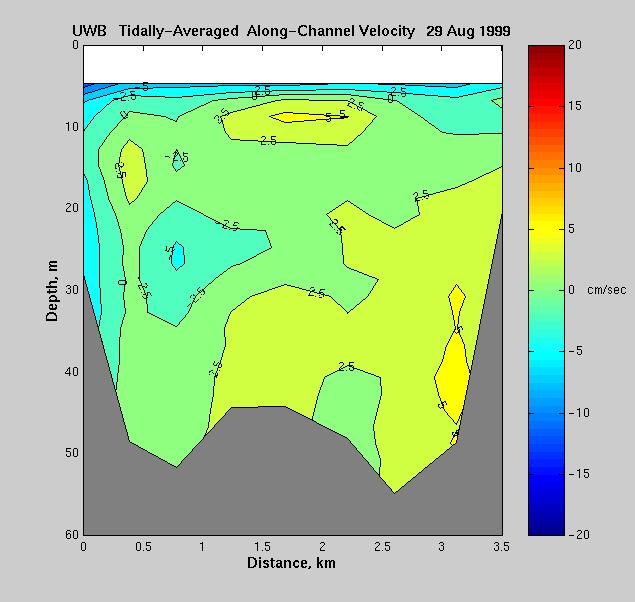
Each section was sampled every 2.5 hours through the 12.42 hour tidal cycle. The profiles for each section were averaged in space to coincide with the CTD stations, and then the data were averaged, effectively removing the tidal currents. The residual currents were then rotated for MPB and UWB to obtain along-channel and cross-channel flows. The UEB section did not require any rotation. The residual current section plots are shown for MBP in Figures 24 and 25; UEB section plots are found in Figures 26 and 27; UWB section plots are shown in Figures 28 and 29.
-
CTD DATA ACQUISITION
-
Acquistion Hardware
The CTD hardware system consisted of a pumped Sea-Bird SBE 25 Sealogger CTD. The SBE 25 is self-powered, sampled at 8 hertz, and was equipped with Sea-Bird conductivity, temperature, and pressure sensors. In addition, a YSI 5739 dissolved oxygen probe was interfaced to the CTD. The CTD sensors and oxygen probe were calibrated at the Sea-Bird calibration facility prior to the survey cruise and the oxygen probe was recalibrated at the University of Maine after the survey. The CTD was interfaced to a PC for data monitoring and acquisition.
-
CTD Data Processing
Seasoft, a suite of data processing programs provided by Sea-Bird Electronics, Inc., was used to process each of the CTD casts. The following Seasoft routines were sequentially applied to all the CTD data.
- DATCNV
This program was used to convert hexadecimal counts to engineering units. The converted data were pressure in decibars, temperature in ITS-90 (degrees Celsius), conductivity in Siemens/meter, oxygen current, and oxygen temperature.
- ALIGNCTD
Since the measured values for the CTD sensors can be shifted in time due to a) the sensors being physically separated or b) variable sensor response times, a correction is applied. For the report, a correction of 0.073 seconds was applied to the conductivity data and a 3.25 corrections was made to the oxygen data for the slower response of those sensors relative to pressure and temperature.
- WILDEDIT
This program edited out the wild or "bad" data points from the CTD casts. These points were defined as those that fell outside of 2 standard deviations from a 100-scan running mean. The bad data points are flagged and not used in other calculations.
- CELLTM
A recursive filter was applied to the conductivity data to correct for the thermal mass of the conductivity cell. The calibration values and algorithm used for this calculation were provided by the manufacturer.
- LOOPEDIT
In heavy seas, the CTD descent rate can slow or reverse direction. In this analysis we used a fixed downward minimum velocity of 0.05 m/sec. Data not conforming to this standard were discarded.
- DERIVE
The measured values of oxygen current, oxygen temperature, pressure, and CTD temperature were used to compute dissolved oxygen (ml/l) prior to averaging the data, as recommended by the manufacturer.
- BINAVG
This program vertically averaged the data to a prescribed bin size. For this data report, the bin size was 0.5 meters, starting at 0.5 meters below the surface. In some instances, the near surface data was too noisy for a consistent reading, and these data were excluded from the archived data sets.
- DERIVE
After the data were averaged, DERIVE was used to compute salinity and potential density from the measured values. These final ASCII files were subsequently exported into a graphics program for display.
- DATCNV
-
CTD Data Presentation
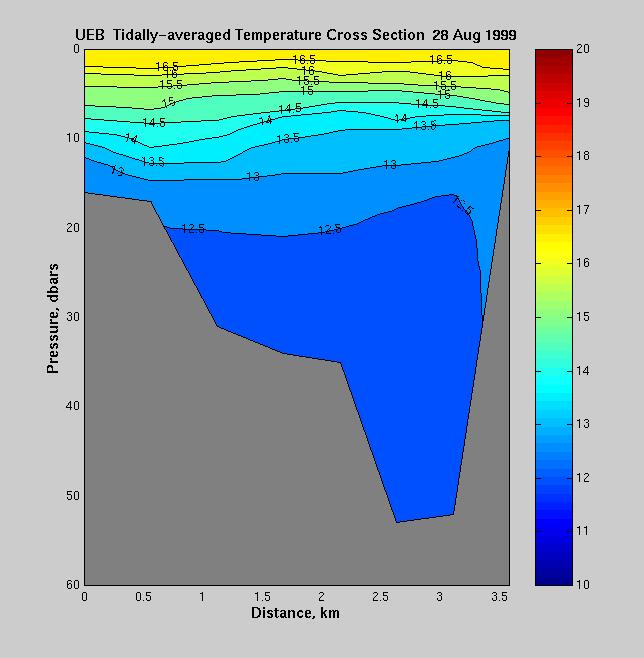
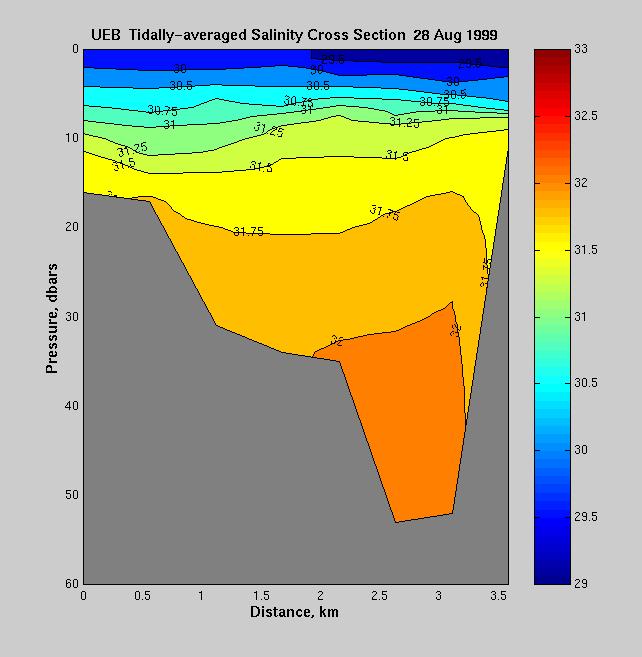
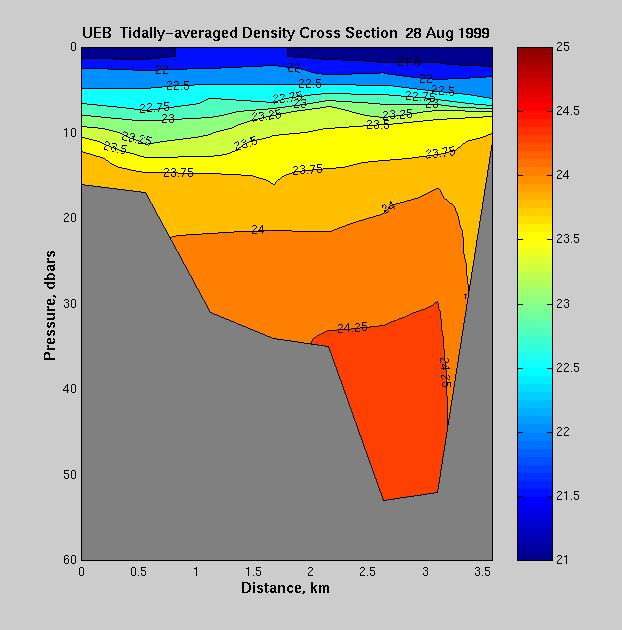
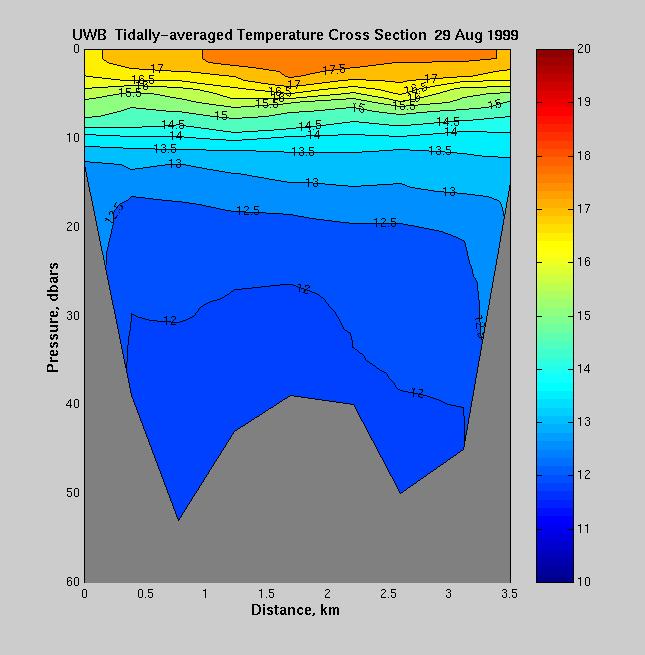
For each of the three transects shown on Figure 3 (MPB, UWB, and UEB), CTD stations were established at a spacing of 0.5 and 1.0 nautical miles, depending on the length of the transect. There were between 8 and 10 stations on each transect. CTD stations were reoccupied every 2.5 hours throughout the 12.42 hour tidal cycle. The data for each station was subsequently averaged, thus effectively eliminating the tidal effects, leaving what we interpret as the seasonal mean conditions. The mean temperature, salinity, and density sections for each of the three sections are shown in Figures 30, 31, 32 (MPB); 33, 34 35 (UEB); and 36, 37, 38 (UWB). Individual profiles of temperature, salinity, sigma-theta, and dissolved oxygen for each station are shown in figures 39 through 173.
-
ACKNOWLEDGEMENTS
We would like to thank Captain Don Bradford and the crew of the R/V ARGO MAINE for their help and expertise during the November 1998, December 1998, and May 1999 mooring deployment and recovery cruises. Captain Corrie Roberts of the RV ALICE SIEGMUND is commended for her capable seamanship and long days throughout the three-day hydrographic/ADCP survey cruise, and also on the trips to replace the batteries on the two moorings in the lower bay and to recover the WPB-03 mooring after it had broken free. Finally, we would like to thank Captain Mike Berzinis and his crew on the FV MOBY DICK for their assistance on the two-day mooring recovery cruise. This report was prepared for the Island Institute of Rockland, Maine. Funding for this work was provided by NOAA's National Environmental Satellite, Data,and INformation Service ( NESDIS).Figure Captions
Figure 2. The location of the five ODAS buoys (labeled WPB, EPB, UWB, UEB, and MSC).
Figure 3. Location of hydrographic transects (labeled MPB, UWB, and UEB) and CTD stations during the August 1999 hydrographic survey.
Figure 4. WPB-03 ADCP residual velocity time series data from 2 meters to a depth of 32 meters.
Figure 5. WPB-03 ADCP residual velocity time series data from 34 meters to a depth of 64 meters.
Figure 6. WPB-03 residual velocity time series data from 68 meters to a depth of 92 meters.
Figure 7. WPB-03 Seacat residual temperature, salinity, and density time series. The nominal depths of the sensors are indicated.
Figure 8. EPB-03 ADCP residual velocity time series data from 2 meters to a depth of 18 meters.
Figure 9. EPB-03 ADCP residual velocity time series data from 20 meters to a depth of 32 meters.
Figure 10. EPB-03 ADCP residual velocity time series data from 34 meters to a depth of 48 meters.
Figure 11. EPB-03 Seacat residual temperature, salinity, and density time series. The nominal depths of the sensors are indicated.
Figure 12. UWB-01 surface wind stress and ADCP residual velocity time series data from the surface to a depth of 20 meters.
Figure 13. UWB-01 ADCP residual velocity time series data from 22 meters to a depth of 36 meters.
Figure 14. UWB-01 Seacat residual temperature, salinity, and density time series. The nominal depths of the sensors are indicated.
Figure 15. UEB-01 surface wind stress and ADCP residual velocity time series data from the surface to a depth of 20 meters.
Figure 16. UEB-01 ADCP residual velocity time series data from 22 meters to a depth of 38 meters.
Figure 17. UEB-01 ADCP residual velocity time series data from 40 meters to a depth of 56 meters.
Figure 18. UEB-01 Seacat residual temperature, salinity, and density time series. The nominal depths of the sensors are indicated.
Figure 19. MSC-01 ADCP residual velocity time series data from 8 meters to a depth of 32 meters.
Figure 20. MSC-01 ADCP residual velocity time series data from 36 meters to a depth of 64 meters.
Figure 21. MSC-01 Seacat residual temperature, salinity, and density time series. The nominal depths of the sensors are indicated.
Figure 22. Wind stress (in pascals) from NOAA's National Data Buoy Center C-MAN station at Mount Desert Rock during 1999. The northward component is displayed in the upper panel and the eastward component is shown in the lower panel.
Figure 23. River discharge (in cubic feet per second) during 1999 from the USGS gauging statioin at West Enfield, Maine.
Figure 24. Tidally averaged along-channel current (in cm/sec) on the MPB transect on 27 August 1999.
Figure 25. Tidally averaged cross-channel current (in cm/sec) on the MPB transect on 27 August 1999.
Figure 26. Tidally averaged along-channel current (in cm/sec) on the UEB transect on 28 August 1999.
Figure 27. Tidally averaged cross-channel current (in cm/sec) on the UEB transect on 28 August 1999.
Figure 28. Tidally averaged along-channel current (in cm/sec) on the UWB transect on 29 August 1999.
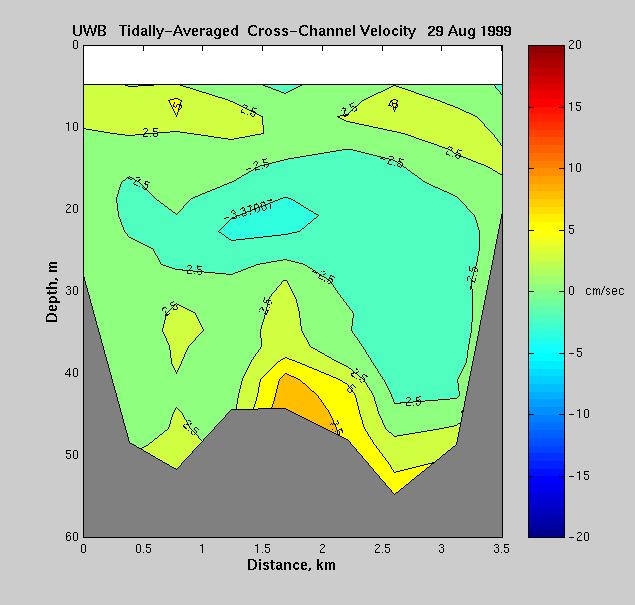
Figure 29. Tidally averaged cross-channel current (in cm/sec) on the UWB transect on 29 August 1999.
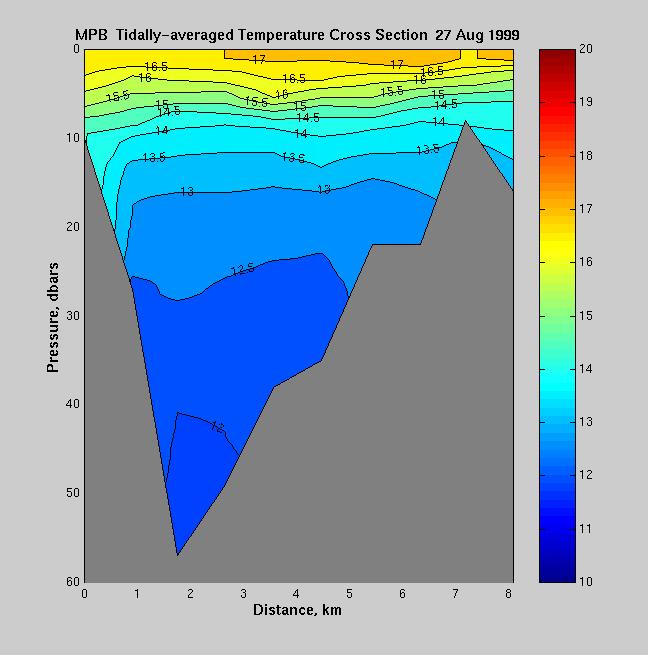
Figure 30. Tidally averaged temperature cross section on the MPB transect on 27 August 1999.
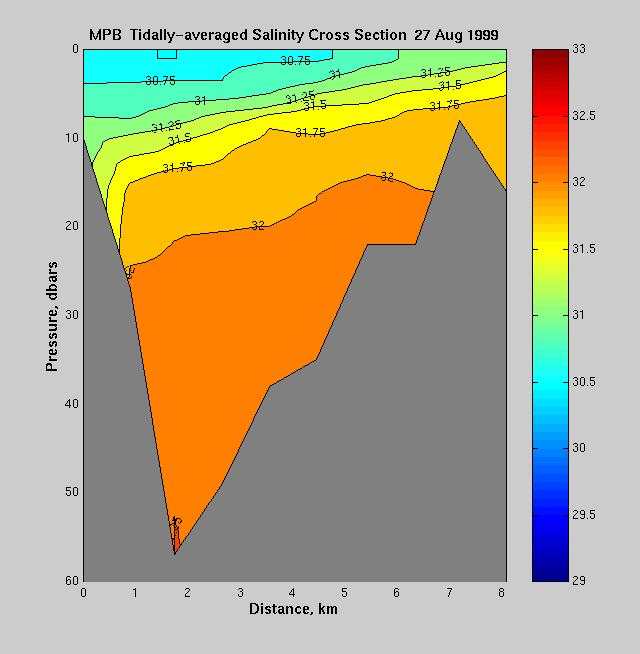
Figure 31. Tidally averaged salinity cross section on the MPB transect on 27 August 1999.
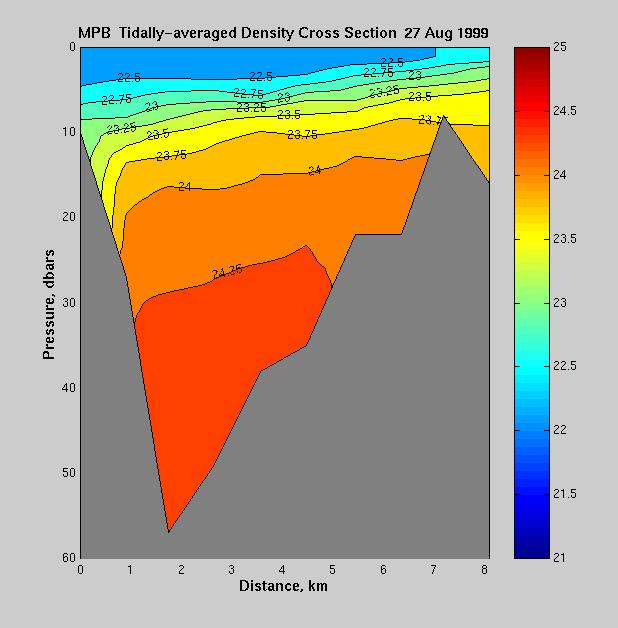
Figure 32. Tidally averaged density cross section on the MPB transect on 27 August 1999.
Figure 33. Tidally averaged temperature cross section on the UEB transect on 28 August 1999.
Figure 34. Tidally averaged salinity cross section on the UEB transect on 28 August 1999.
Figure 35. Tidally averaged density cross section on the UEB transect on 28 August 1999.
Figure 36. Tidally averaged temperature cross section on the UWB transect on 29 August 1999.
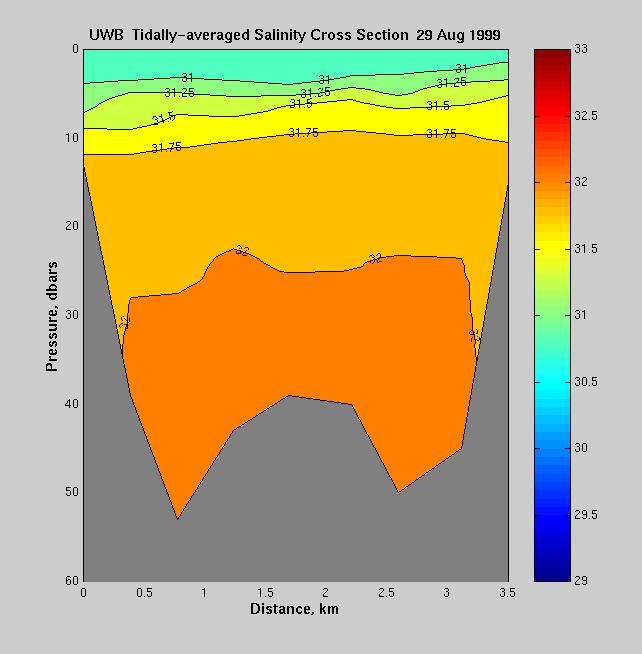
Figure 37. Tidally averaged salinity cross section on the UWB transect on 29 August 1999.
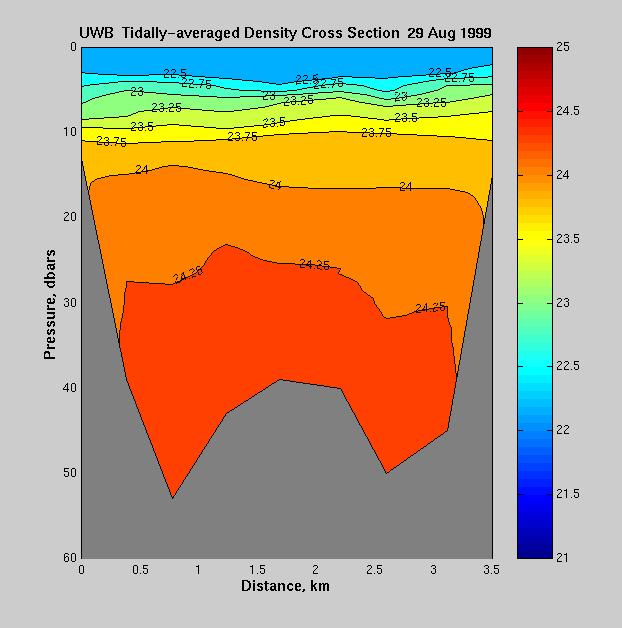
Figure 38. Tidally averaged density cross section on the UWB transect on 29 August 1999.
Figures 39 - 163. CTD station plots of temperature, salinity, sigma-theta (density), and dissolved oxygen as a function of pressure (decibars) for each cast during the August 1999 hydrographic survey.