

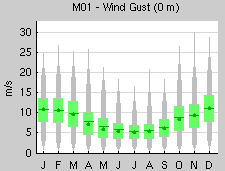
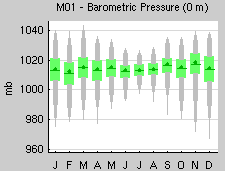
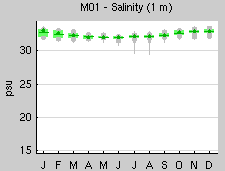
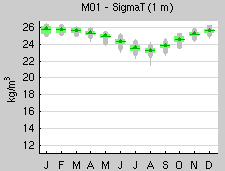
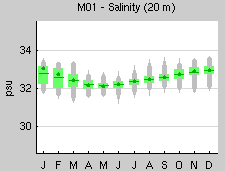
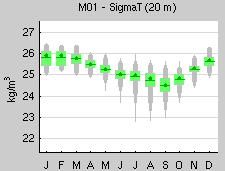
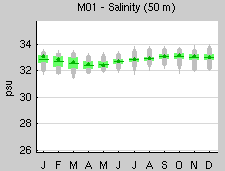
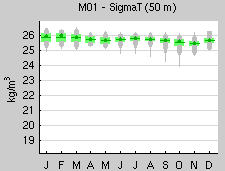
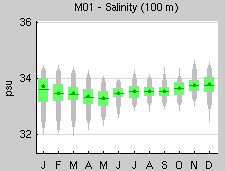
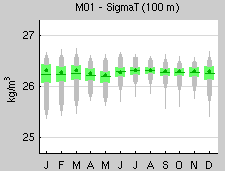
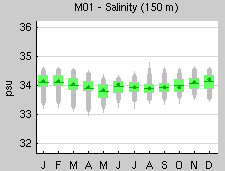
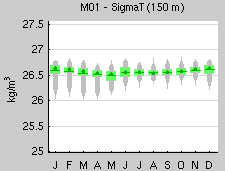
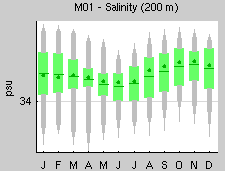
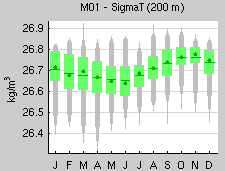
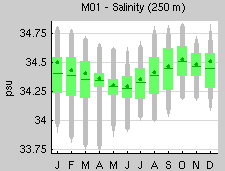
Monthly Climatology Box Plots, showing median (green dot), mean (green line) ,IQR (green shaded) ,5th and 95th percentiles (thick gray bar), 1st and 99th pecentiles by slighly thicker gray bar. Full range of data indicated by the thin gray lines.
| Waves |  |
 |
|
| Winds | 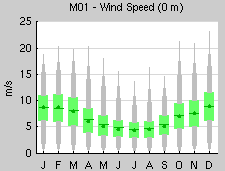 |
 |
|
| Air Temp/Pres | 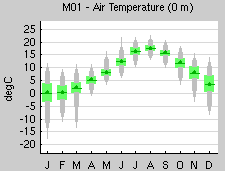 |
 |
|
| 1m | 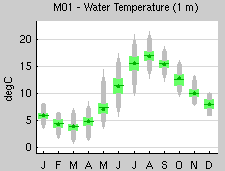 |
 |
 |
| 20m |  |
 |
 |
| 50m | 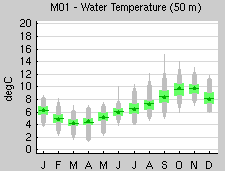 |
 |
 |
| 100m |  |
 |
 |
| 150m | 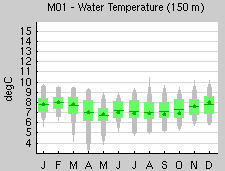 |
 |
 |
| 200m | 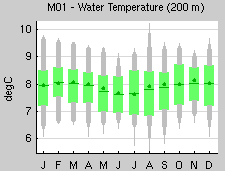 |
 |
 |
| 250m |  |
 |
 |