The University of Maine
/
School of Marine Sciences
Physical Oceanography Group
Dr. Neal Pettigrew
Home
Moorings
Mooring Map
A01
B01
C01
D01
E01
E07
F01
F03
I01
J04
M01
N01
PR1
PR2
PR3
VI1
Active Projects
CARICOOS
Gliders
Archived Projects
CICESE
Codar
EcOHAB
PenBay
RMRP
AsiaEx-2000
ASTTEX
Helpful Links
Resources
Staff
MSDS Information
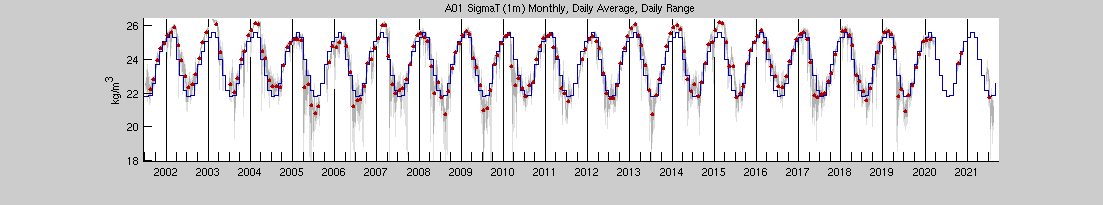
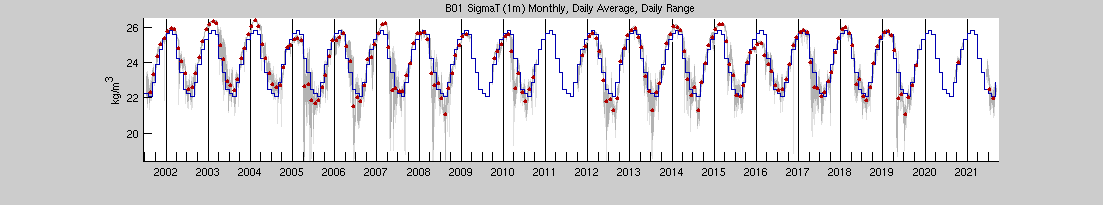
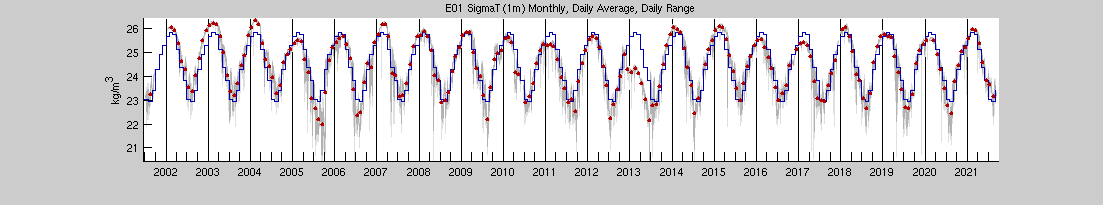
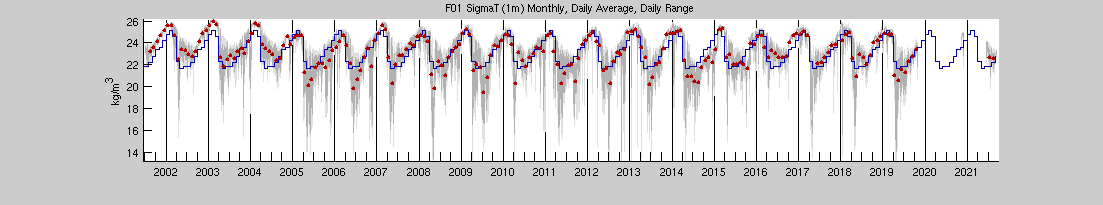
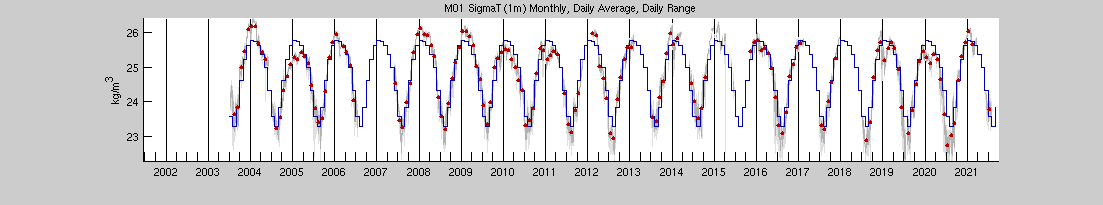
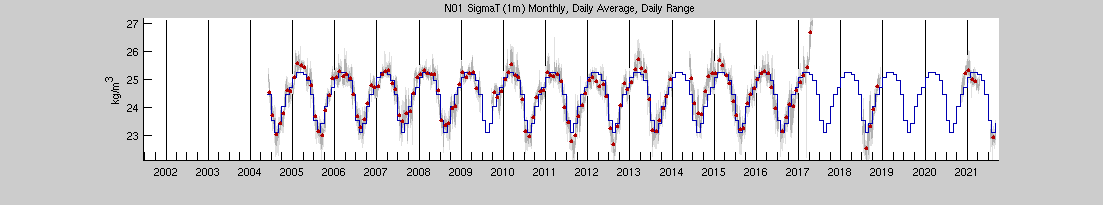
Preliminary Buoy Climatology
Sigma_t, 1m
Daily (gray lines) and Monthly (red dots) Averaged Buoy Data with Monthly Climatology (blue lines).